Northern Ireland: a century of change in statistics
The first Census in Northern Ireland took place a hundred years ago, on 18 April 1926.
This quick read gives a snapshot of the main changes over the century. For more detail you can read the report, Northern Ireland: a century of change in statistics.
Our population has grown by 51%
In the 1926 Census, the population of Northern Ireland was 1.26 million. In the 2021 Census, our population had grown to 1.9 million. That is an increase of 640,000 people.
Some areas have grown more than others
Population growth has not been the same across Northern Ireland. Derry~Londonderry, Armagh and Down have seen the most growth. Fermanagh has changed the least.
Our age profile has changed
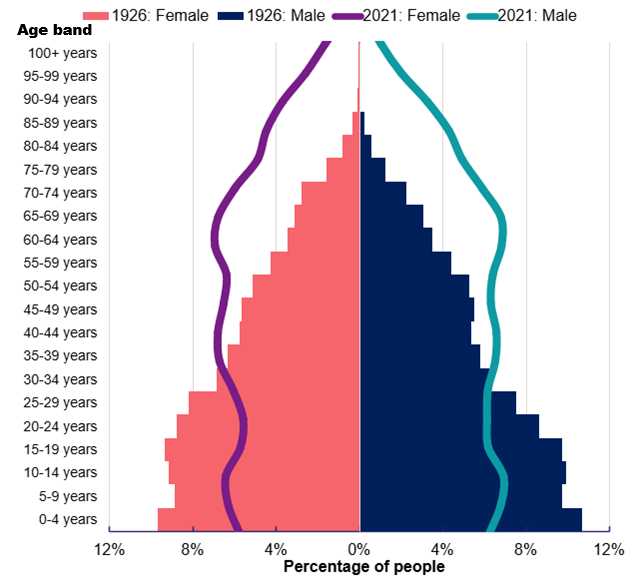
In 1926, we had a younger population. Now, we have a more even spread of ages. People are also living longer. At both time points, there are slightly more women than men overall.
Figure 1: Population pyramid
Religious affiliation has changed
In 1926, two thirds of people said they were Protestant or other Christian. One third said they were Catholic. By 2021:
- the percentage of people with no religion has grown from nearly zero to over 17%
- the percentage who were Protestant or other Christian has fallen (to 37%)
- the percentage who were Catholic has risen (to 42%)
- the percentage of people with other religions has also grown (to over 1%)
Our population is more diverse
The percentage of people who were born outside of Northern Ireland has grown from 10% to 13%.
In 1926 nearly everyone born outside Northern Ireland was born in the UK or Ireland. The percentage of people living here who were born outside of the UK or Ireland has grown from 0.6% to 6.5%.
Our population has increased by half, but the number of households has nearly tripled
There are almost half as many people per household as there used to be. On average there were:
- 4.54 people per household in 1926
- 2.44 people per household in 2021
Our homes have more living space
A century ago, it was much more common to have more than two people sharing a room. Today it is very rare. The percentage of households with more than two people per room has fallen from:
- 18.15% in 1926
- 0.20% in 2021
There has been a big shift towards urban living
The number of households in towns and cities has more than quadrupled. In rural areas the number of households has almost doubled.
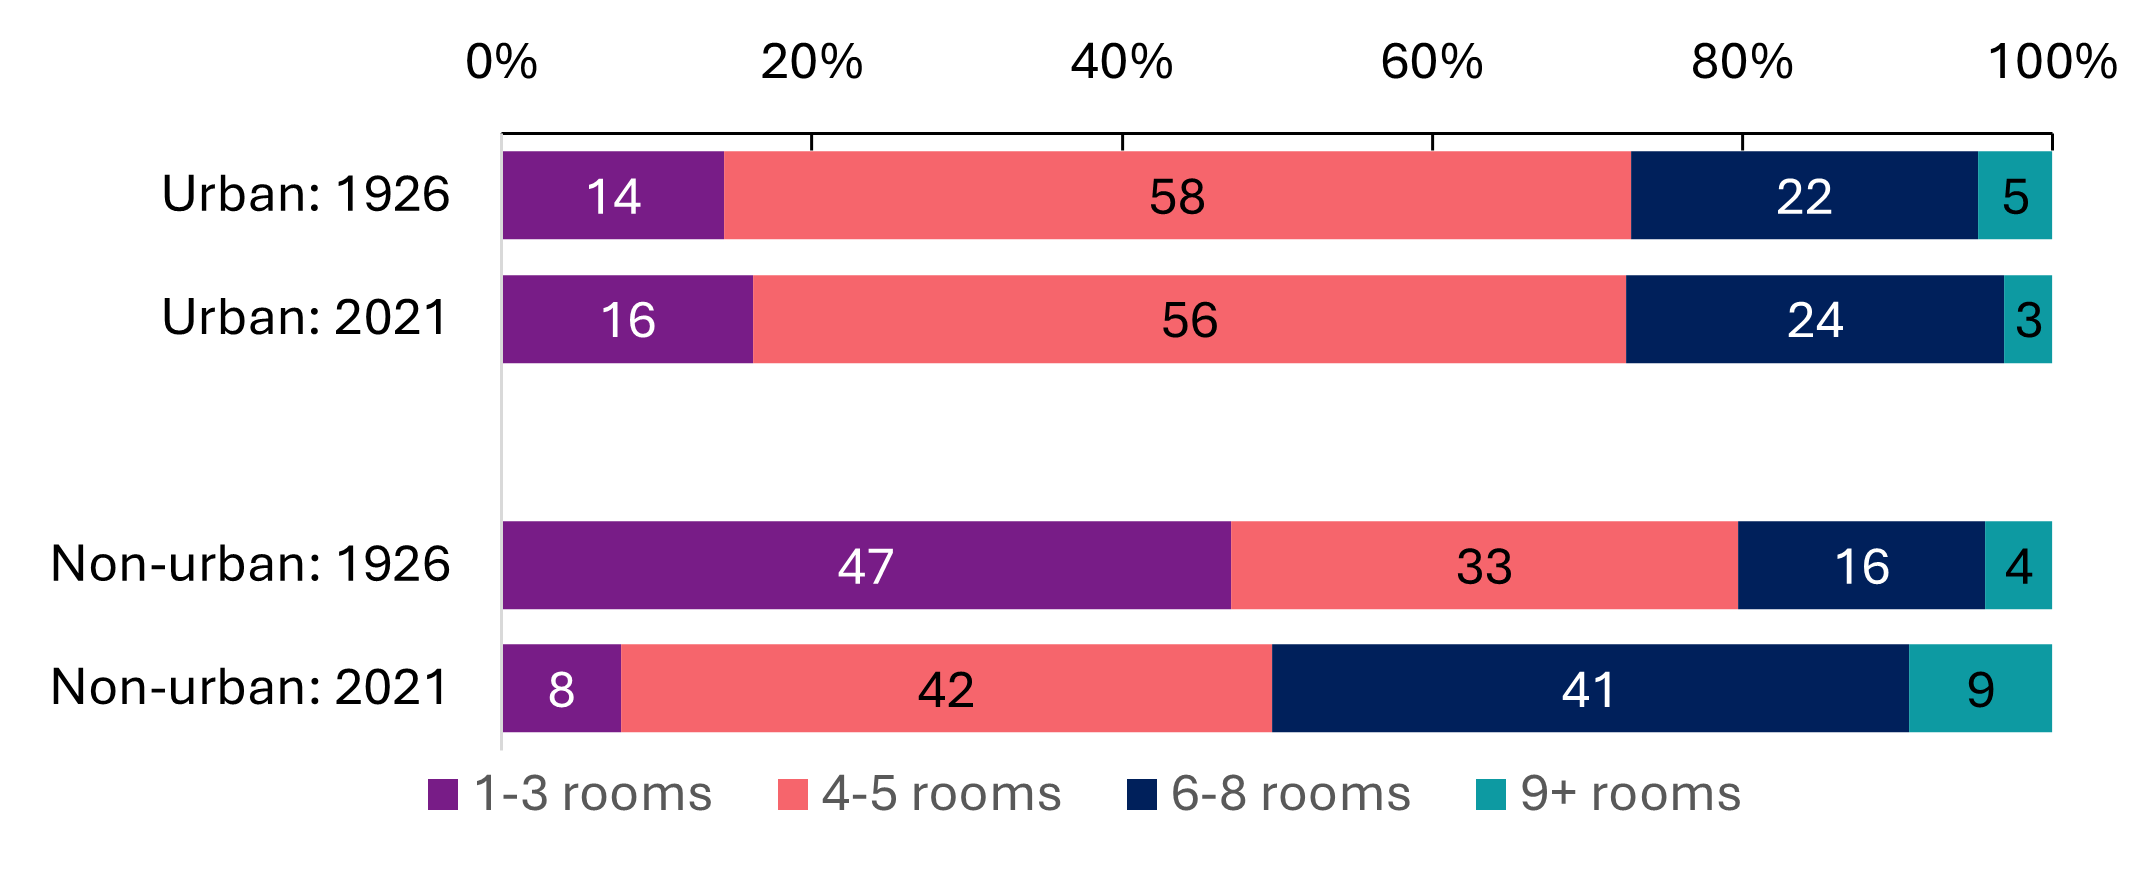
The size of our homes outside towns and cities has also changed. In 1926, the majority had between 1 and 3 rooms. These houses are now the minority.
Figure 2: Rooms per household
Education continues for much longer than it did 100 years ago
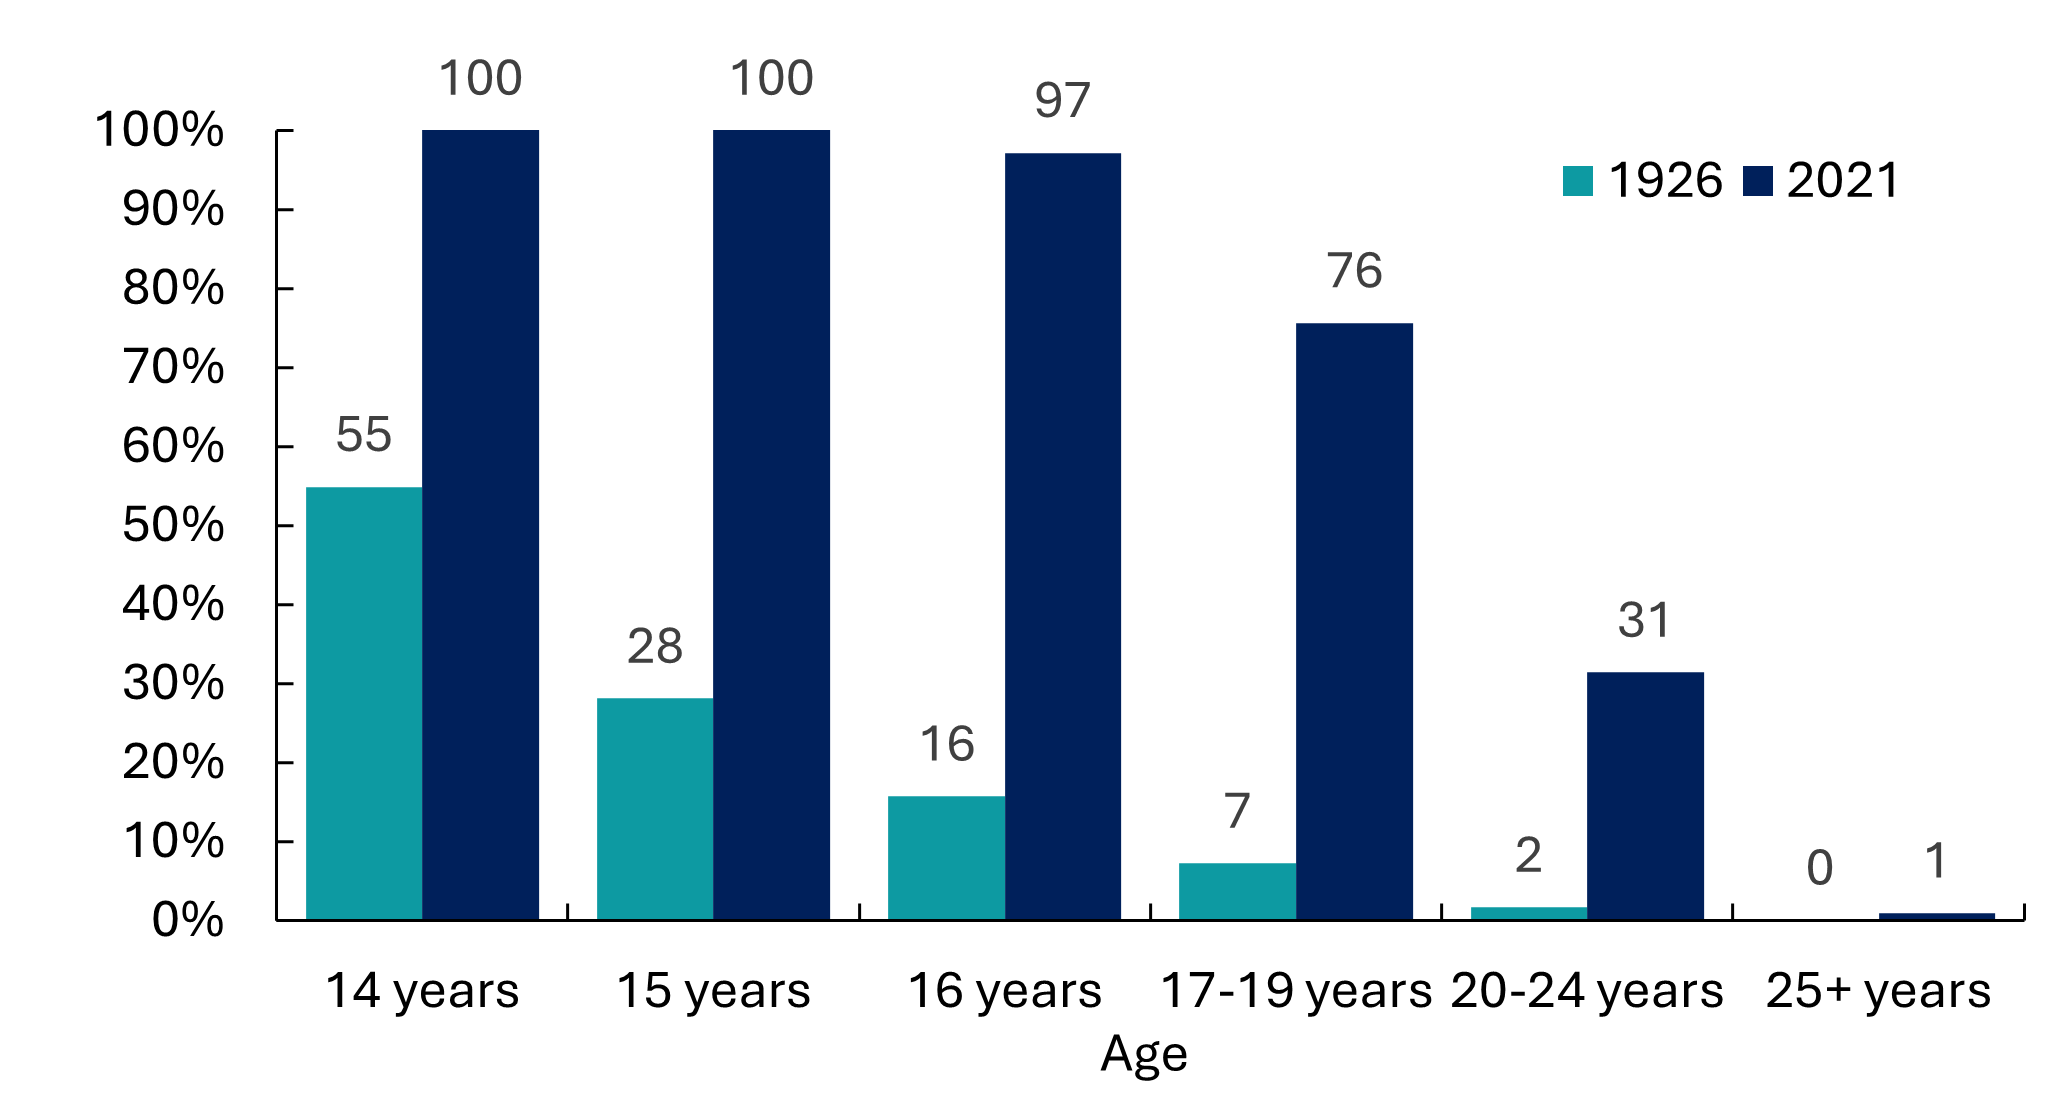
In 1926, large numbers of children left school after the age of 13. Just over half of 14-year-olds, and a quarter of 15-year-olds were still in school a century ago. Only a very small percentage continued in full-time education after the age of 20.
In 2021 we see a much slower drop off at the end of compulsory education. A much higher percentage of people also continue in full-time education after the age of 20.
Figure 3: Percentage of people in full-time education by age group
Our working lives are shorter
In 1926 our potential working population was aged 12 and over. Today, because of labour laws and longer compulsory education, the minimum age is 16.
In 1926, working lives started younger and finished later
A century ago, working life had started for 1 in 5 children aged between 12 and 15. The majority were economically active (which means they were either working or looking for work) by the age of 16 to 19. In 2021 the majority are not economically active until age 20 to 24.
Figure 4: Population working or looking for work by age group
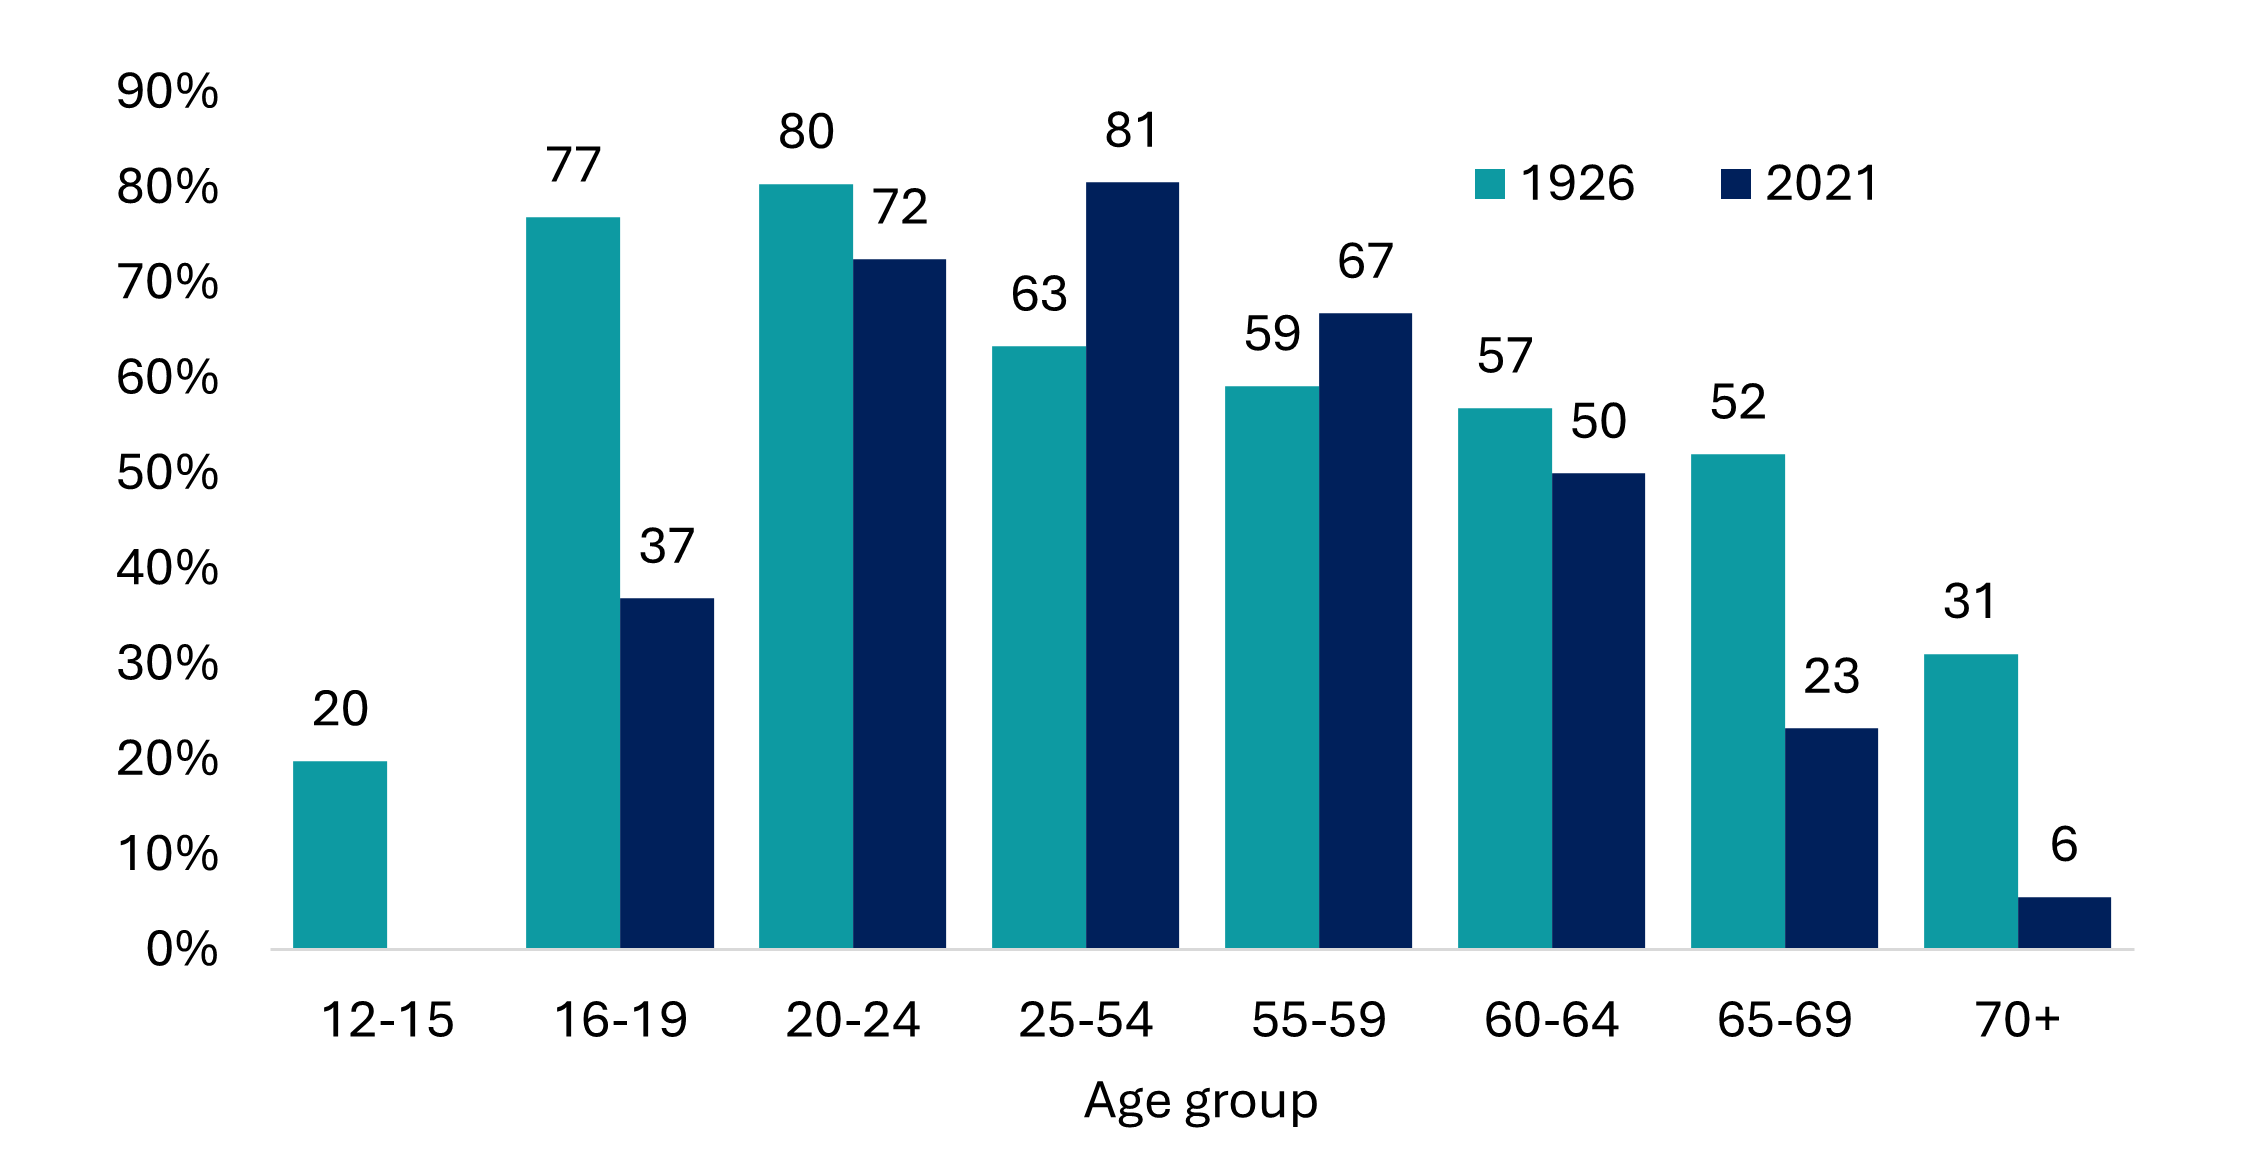
More than half of 65- to 69-year-olds were still economically active in 1926, as were just under a third of people age 70 or older.
In 2021, less than a quarter of 65- to 69-year-olds were economically active.
More women are working
Considerably more women are working now than a century ago. This increase is matched by a decrease in women who are economically inactive. Economically inactive includes students, retired people, people who are unable to work due to illness or disability and those who cannot work because they have caring responsibilities.
Figure 5: Economically active population by sex
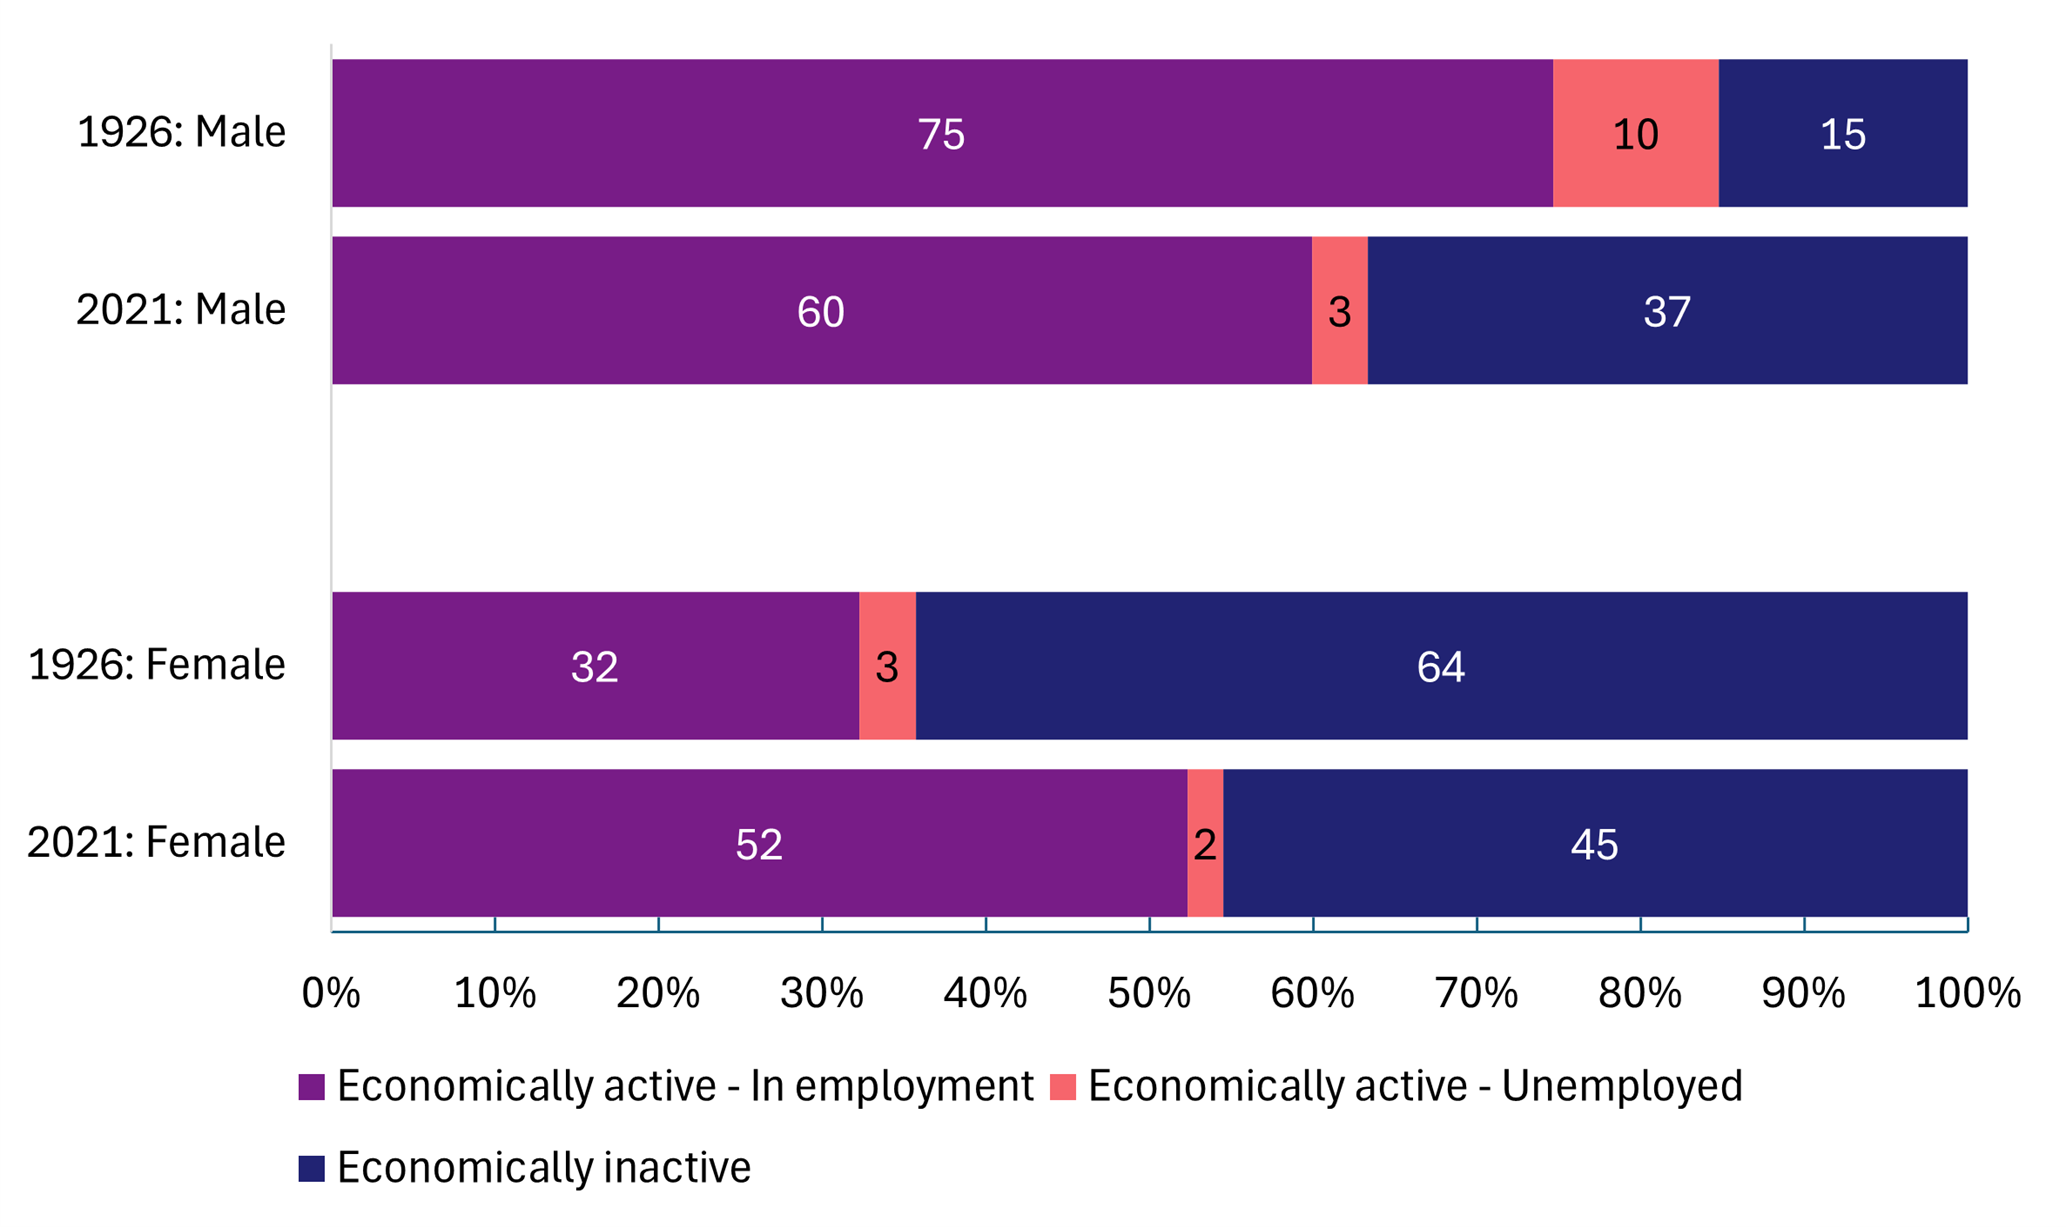
For men, the changes are smaller, but there are still differences. Compared to a century ago:
- fewer men are working
- fewer men are unemployed (looking for work)
- more men are economically inactive
The type of work we do has changed
1926 Northern Ireland was an industrial economy where manufacturing and fishing and agriculture were the biggest employers. Together, these industries employed almost two-thirds of the working population.
In 2021 only 3% of the working population are employed in fishing and agriculture. Manufacturing has dropped to 18%.
Only 3% of the population were in professional occupations in 1926. This includes roles such as engineers, doctors and other health workers, scientists and teachers.
Today’s service economy means the largest employers are professional occupations and commerce and finance. Together, these industries employ about half the working population.
Terms and definitions
Some of the terms such as employed, unemployed and professions will have changed over the years. For more detail refer to the main report linked at the top of this page.
More census information
Census Area Explorer is an interactive, visual tool for exploring a wide range of data from Census 2021. It allows you to select which geographical areas you wish to explore, and you can compare results with the previous 2011 Census.
There are more census resources to explore on the website.